
See also


 13.11.2026 05:35 AM
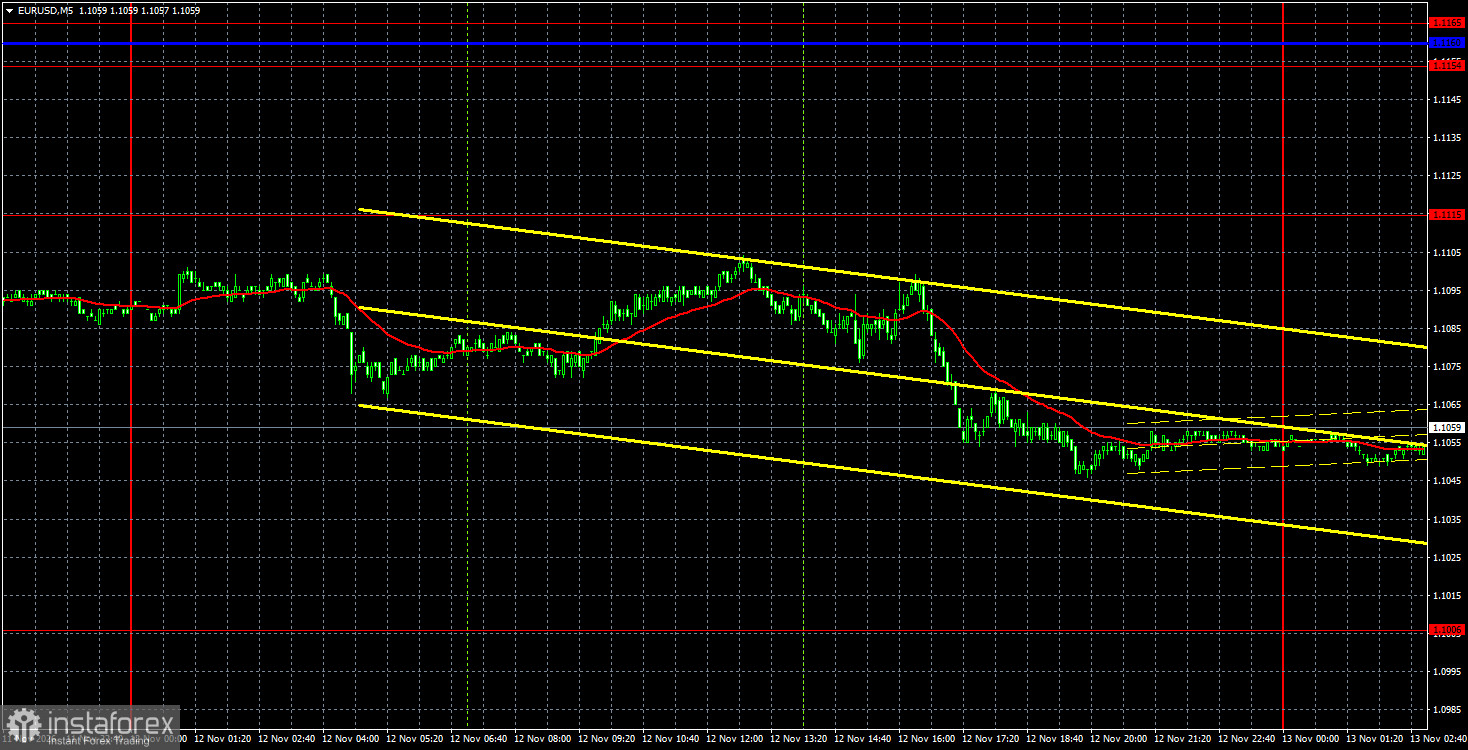
The EUR/USD pair continued its downward move on Thursday, although at a calmer pace than on Tuesday or Wednesday. Recall that, in essence, this week's dollar strength was triggered by the US inflation report, which in month-on-month terms printed 0.1 percentage point above consensus. That extra 0.1% — beyond what the market had been prepared for — was enough to send the US currency higher for three consecutive days, resulting in a gain of nearly 200 pips. Such are the realities of the FX market at the end of 2026: one inflation report that does not materially change the Federal Reserve's policy outlook through year-end, and the dollar rockets. The European Central Bank has tightened policy faster and more aggressively than the Fed — yet the euro has been falling for three months straight. We continue to believe that the ongoing decline in the pair, which began three months ago, is technical and speculative and does not match the current fundamental and macroeconomic backdrop. The market interprets most incoming information in favor of the dollar and disregards positives for the euro. This week, the price left the 1.1115–1.1261 sideways channel where it had spent a month, and the euro failed to show any meaningful correction after its two-month collapse.
Technically, the EUR/USD pair has exited the 1.1115–1.1261 sideways channel — and it did so via the boundary few expected. The euro's decline can now continue, and whether there are reasons for a new rally no longer seems to matter. In the present environment, a single report can trigger three days of dollar strength.
On the 5-minute timeframe, no new trading signals formed on Thursday. The last sell signal appeared on Wednesday after the break of 1.1115. Traders could have rolled short positions into Thursday and then into Friday, moved stops to breakeven, or taken profits—currently about 45 pips.
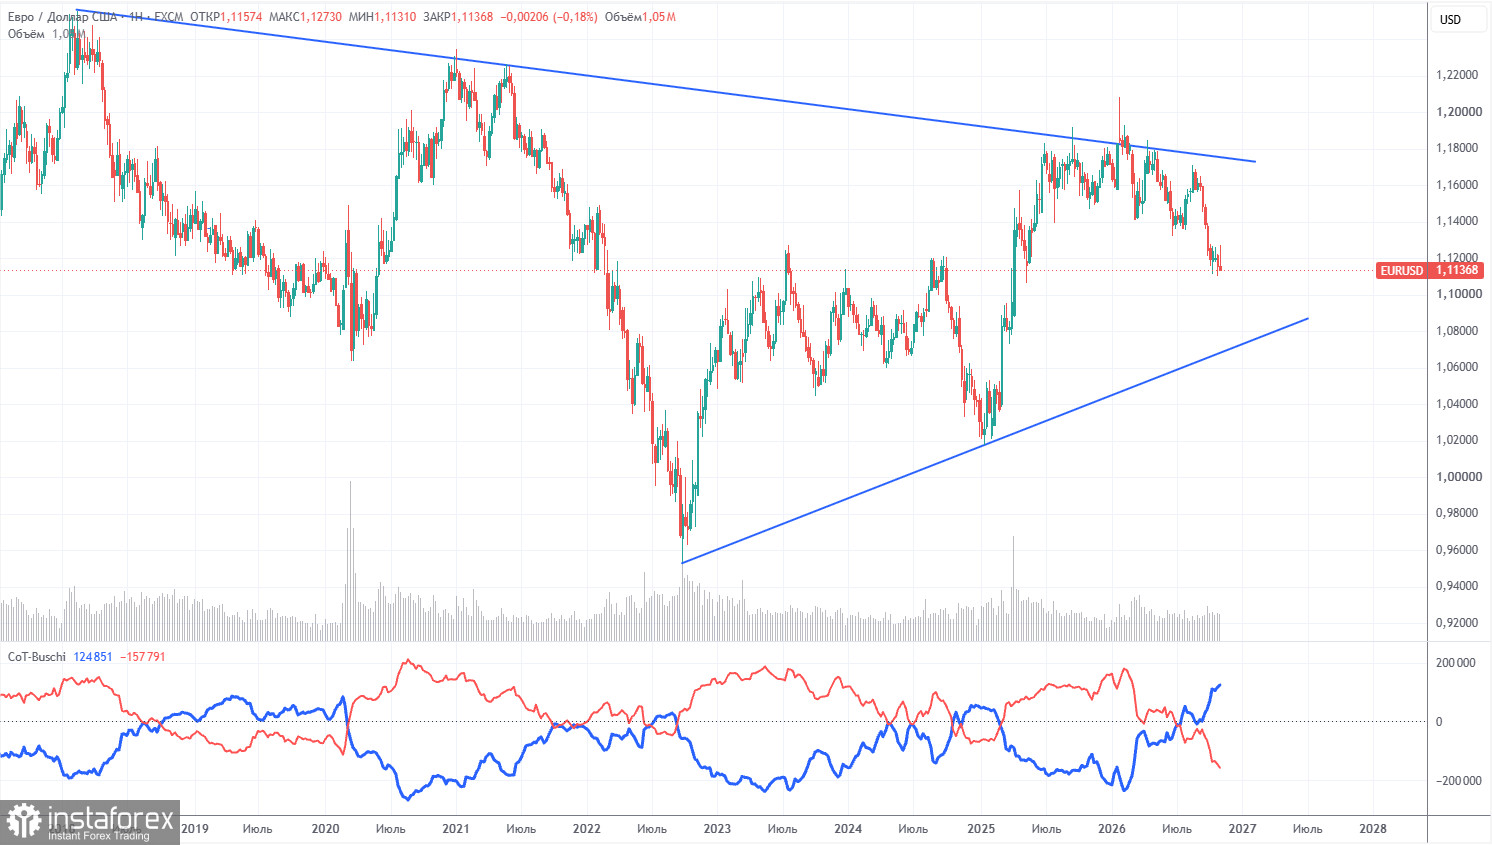
The latest COT report is dated November 3. On the weekly timeframe, it clearly shows that non-commercial traders' net position remains bearish and has fallen significantly in 2026 due to geopolitical events. Over the past eight months, traders have been cutting euro exposure in favor of the US dollar. Donald Trump's policies have not changed, which likely prevents the dollar from counting on long-term structural gains.
We still do not see fundamental factors that justify a sustained strengthening of the US currency. The Middle East war made the dollar temporarily extremely attractive, and the Fed's policy stance surprised the dollar for the second time this year. In the long run, the euro could fall as low as $1.08 (trendline), yet the longer-term uptrend remains relevant. Nevertheless, in recent months the market has considered only factors positive for the dollar and ignored everything else.
The positions of the Ichimoku red and blue lines indicate a bear advantage. Over the last reporting week, the number of longs among the "Non-commercial" group fell by 1,300 while shorts rose by 12,600. Accordingly, the net position decreased by another 13,900 contracts during the week.
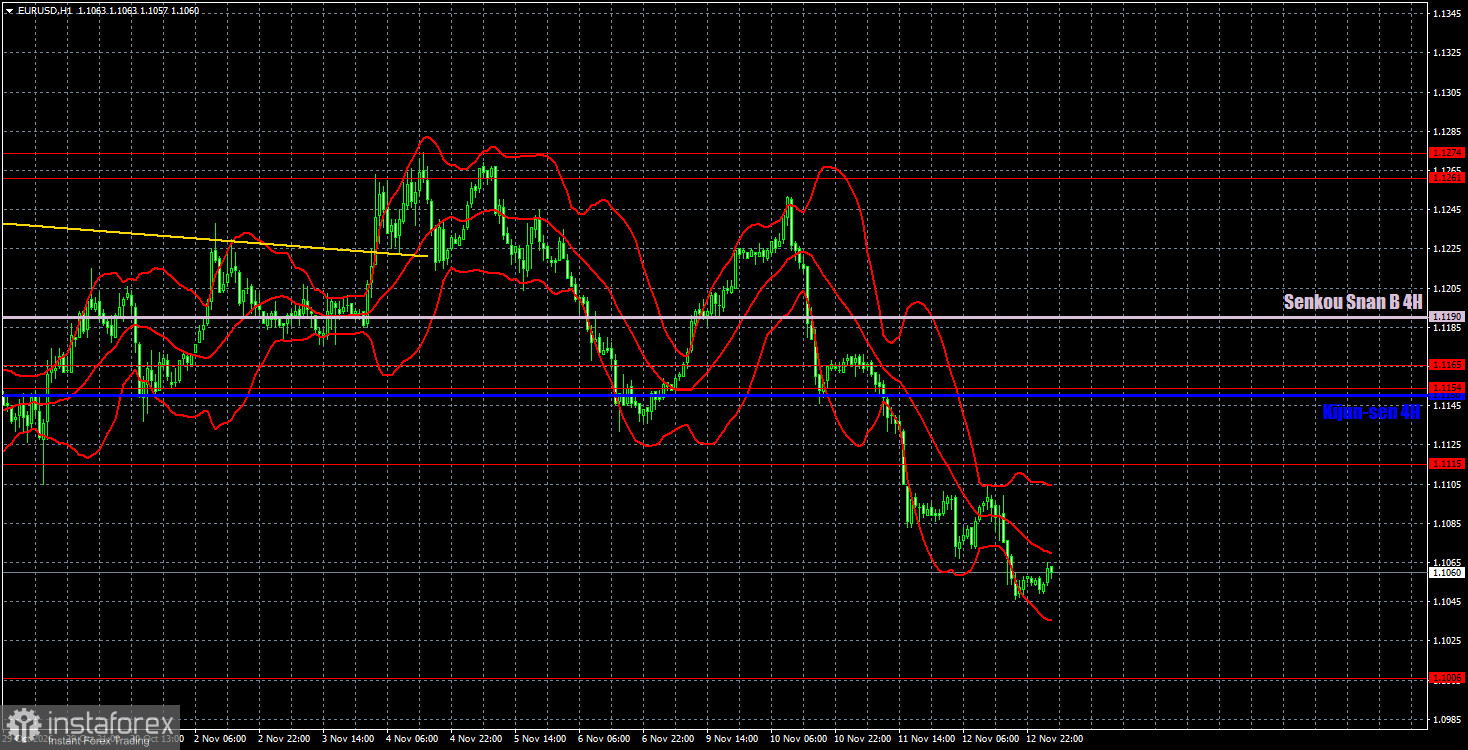
On the hourly timeframe, the EUR/USD pair has resumed its three-month downtrend without a single meaningful correction. On the daily and weekly timeframes, the chances of a strong, sustained trend remain high. However, for the euro to rise, it must be bought. Over the past three months, we have not seen any willingness in the market to buy the euro.
For November 13 we highlight the following levels for trading — 1.0949, 1.1006, 1.1115, 1.1154–1.1165, 1.1261–1.1274, 1.1362–1.1368, 1.1461–1.1473, 1.1536–1.1542, 1.1585, 1.1657–1.1665, as well as the Ichimoku Senkou Span B line (1.1190) and Kijun-sen (1.1150). The Ichimoku indicator lines may shift during the day, which should be taken into account when determining trade signals. Remember to move your Stop Loss to breakeven if the price moves 15 pips in the correct direction. This will protect against possible losses if the signal proves false.
On Friday, traders may watch the US Producer Price Index and the second estimate of Q3 GDP for the euro area. We do not expect the GDP revision to draw much reaction from traders or materially help the euro recover. The producer-price report, however, could trigger another leg higher in the dollar if it prints above expectations.
Traders can consider targets for short positions near 1.1006, since the price has closed below 1.1115. On a bounce from 1.1006, one can consider a target for long positions at 1.1115.


